

Visualisations of sociographic data for Lithuania’s major cities have been published

Within the framework of Eurostat project “Data Collection for Urban and Regional Statistics” (2021-2023), the State Data Agency has prepared visualisations based on the sociographic data of the major cities of Lithuania in order to promote and visually present relevant statistical information to the public.
The dashboard provided on the Official Statistics Portal presents information on the population, density, employment rate, proportion of the population by education, the number of dismissed employees, the number of arrivals and departures, gross earnings, gender pay gap, average prices of dwellings and the number of individual passenger cars.
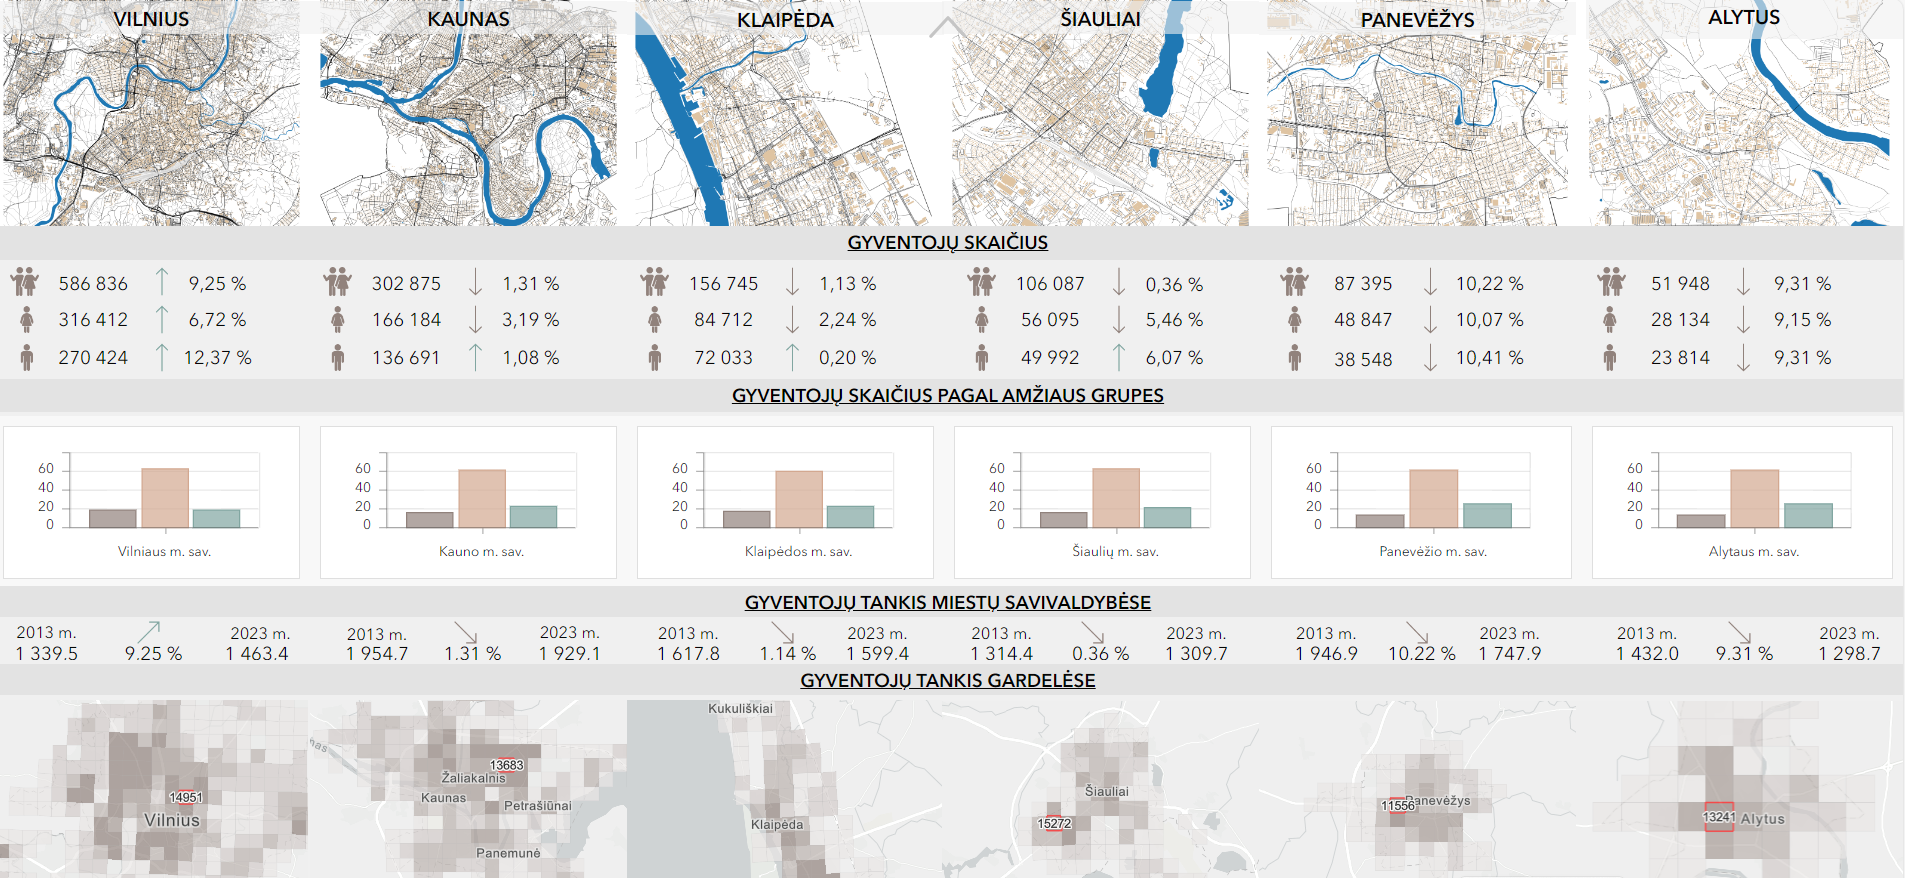
Infographics for 6 cities (Vilnius, Kaunas, Klaipėda, Šiauliai, Panevėžys and Alytus) have also been prepared for educational purposes.
Last updated: 14-02-2024
Related news:
We Invite You to Submit Proposals for the 2027 Official Statistics Programme
OECD and the EU Invite Participation in the International R&D Careers Survey
Another State Data Lake Training Cycle Completed
How to Recognize a Survey Interviewer from the State Data Agency (Statistics Lithuania)?